|
Headlines |
Jan-23 |
Dec-22 |
|
Monthly Index* |
523.4 |
526.5 |
|
Monthly Change* |
-0.6% |
-0.3% |
|
Annual Change |
1.1% |
2.8% |
|
Average Price (not seasonally adjusted) |
£258,297 |
£262,068 |
* Seasonally adjusted figure (note that monthly % changes are revised when seasonal adjustment factors are re-estimated)
Commenting on the figures, Robert Gardner, Nationwide's Chief Economist, said:
“The start of 2023 saw a further slowing in annual house price growth to 1.1%, from 2.8% in December. Moreover, January saw a further monthly price fall (-0.6%), which left prices 3.2% lower than their August peak (after taking account of seasonal effects).
“However, there are some encouraging signs that mortgage rates are normalising, but it is too early to tell whether activity in the housing market has started to recover. The fall in house purchase approvals in December reported by the Bank of England largely reflects the sharp decline in mortgage applications following the mini-Budget.
“It will be hard for the market to regain much momentum in the near term as economic headwinds are set to remain strong, with real earnings likely to fall further and the labour market widely projected to weaken as the economy shrinks.
“As we highlighted in our recent affordability report, the biggest change in terms of housing affordability for potential buyers over the last year has been the rise in the cost of servicing the typical mortgage as a result of the increase in mortgage rates.
“Should recent reductions in mortgage rates continue, this should help improve the affordability position for potential buyers, albeit modestly, as will solid rates of income growth (wage growth is currently running at around 7% in the private sector), especially if combined with weak or negative house price growth.
“Nevertheless, the overall affordability situation looks set to remain challenging in the near term. Saving for a deposit is proving a struggle for many given the rising cost of living, especially those in the private rented sector where rents have been rising at their strongest pace on record (on data extending back to 2005 for England).
“High house prices relative to earnings mean deposit requirements remain a major challenge. Moreover, the Help To Buy Equity Loan scheme that helped those with a smaller deposit buy a new build property is due to end in March. However, the government’s mortgage guarantee scheme, which helps to secure the availability and lower the cost of higher loan-to-value mortgages, has been extended until the end of 2023.
How does the affordability picture vary across the UK regions?
“All regions have seen a deterioration in affordability compared to 2021, with the cost of servicing the typical mortgage as a share of take-home pay now at or above the long-run average in all regions.
“Affordability pressures remain particularly acute in London and the south of England, where mortgage servicing costs have risen sharply compared with a year ago. Scotland and the North continue to be the most affordable regions but, even there, mortgage payments as a share of take-home pay are at their highest level for over a decade.
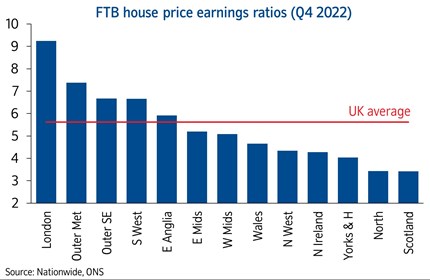
“There continues to be a significant gap between the least affordable and most affordable regions, although this has remained broadly stable over the last year. London continues to have the highest house price to earnings ratio at 9.2, but this is still below its record high of 10.2 in 2016.
“Scotland and the North region have the lowest house price to earnings ratios at 3.4. Over the longer term, Northern England and Scotland have historically seen lower HPERs than Southern England, Wales and Northern Ireland.
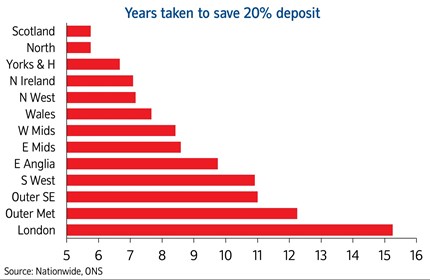
“But there is substantial regional variation, as illustrated below, which shows the average time it would take someone earning the typical wage in each region to save a 20% deposit towards an average FTB property, assuming they set aside 15% of their take-home pay each month.”
-ends-


