Commenting on the figures, Andrew Harvey, Senior Economist, said:
“The biggest change in terms of housing affordability for potential buyers over the past year has been the rise in the cost of servicing the typical mortgage as a result of the increase in mortgage rates.
“This trend began in earnest towards the end of 2021, with typical five-year fixed rates rising from 1.3% in late 2021 to 2.9% by mid-2022, as market interest rates that underpin mortgage pricing rose steadily, reflecting expectations that the Bank of England would have to raise rates significantly in the years ahead to help bring surging inflation back to its target rate of 2%.
“But mortgage rates surged after the mini-Budget in late September, reaching their highest levels since 2010, over four times higher than the lows prevailing in 2021.
“While wider financial market conditions had stabilised by the end of 2022, with market interest rates falling back towards the levels prevailing before the mini-Budget, mortgage rates are taking longer to normalise.
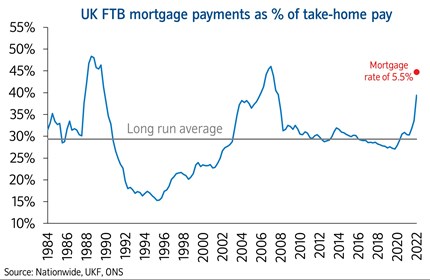
“The impact of this on mortgage affordability is illustrated in the chart (below), which shows first time buyer (FTB) mortgage payments (based on 80% loan-to-value mortgage, at prevailing mortgage rates) as a share of take-home pay.
“This measure is now well above the long run average, at 39% of take-home (net) pay, and close to the levels seen in the run up to the financial crisis.

Raising a deposit remains a significant challenge
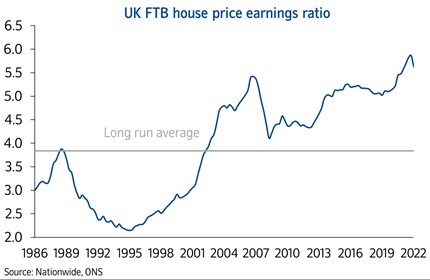
“Unfortunately raising a deposit remains a major hurdle for prospective buyers. In recent quarters, strong wage growth and a small fall in house prices (which fell c2.5% between August and December 2022) has led to a modest fall in the house price to earnings ratio (HPER). But this has done little to improve the situation, as it follows several years when house price growth outpaced earnings by a wide margin.
“For example, between the start of the pandemic and the end of 2022, house prices increased by 19%, while incomes rose by a much more modest 9%. At the end of 2022, the UK first time buyer house price to earnings ratio stood at 5.6, the same level as at the end of 2021.

“This in turn means that a 20% deposit on a typical first time buyer home is now equivalent to 112% of the pre-tax income of a typical full-time employee, a similar level to a year ago, and only modestly below the all-time high of 117% recorded earlier in 2022.
“While UK households, in aggregate, saved £200bn more in bank deposits than we would have expected over the pandemic period as a result of lockdowns, the majority of this was accrued by older, wealthier households and therefore probably helped fewer first time buyers step into the market than it might first appear.
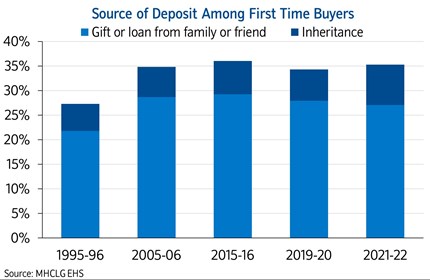
“Indeed, the data suggests that a significant proportion of first time buyers have continued to draw on help from friends and family or an inheritance to help raise a deposit in recent years, as illustrated in the chart below.

“In 2021/22, around a third of first time buyers had some help raising a deposit, either in the form of a gift or loan from family or a friend or through inheritance – up from 27% in the mid-1990s.
What are the prospects for affordability?
“There is some scope for affordability to improve a little in the year ahead. Longer-term interest rates, which underpin mortgage pricing, have fallen back towards the levels prevailing before the mini-Budget.
“If sustained, this should feed through to mortgage rates and improve the affordability position for potential buyers, albeit modestly, as will solid rates of income growth (wage growth is currently running at c.7% in the private sector), especially if combined with weak or negative house price growth.
“Nevertheless, the overall affordability situation looks set to remain challenging in the near term. Saving for a deposit will still be a struggle for many. The cost of living is set to outpace earnings growth by a significant margin again this year, while labour market conditions are widely expected to weaken (albeit from a robust starting position).
“Moreover, rents have also been rising at their strongest pace on record (on data extending back to 2005 for England), which will be a further drag for those currently renting who are looking to buy a home (especially since they also tend to spend a larger share of their income on housing costs than owners with a mortgage).
“The Help to Buy Equity Loan scheme that helped those with a smaller deposit buy a newbuild property is due to end in March. However, the mortgage guarantee scheme which helps to secure the availability and lower the cost of higher LTV mortgages has been extended until the end of 2023.
How does the affordability picture vary across the UK regions?
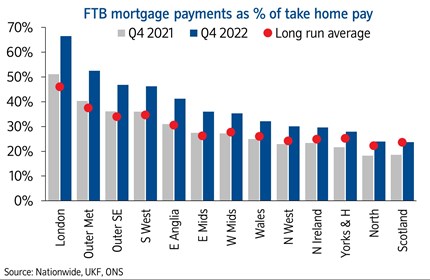
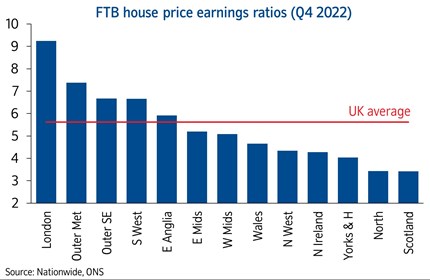
“All regions have seen a deterioration in affordability compared to 2021, with the cost of servicing the typical mortgage as a share of take-home pay now at or above the long-run average in all regions.
“Affordability pressures remain particularly acute in London and the south of England, where mortgage servicing costs have risen sharply compared with a year ago. Scotland and the North continue to be the most affordable regions but, even there, mortgage payments as a share of take-home pay are at their highest level for over a decade.

“There continues to be a significant gap between the least affordable and most affordable regions, although this has remained broadly stable over the last year. London continues to have the highest house price to earnings ratio at 9.2, but this is still below its record high of 10.2 in 2016.

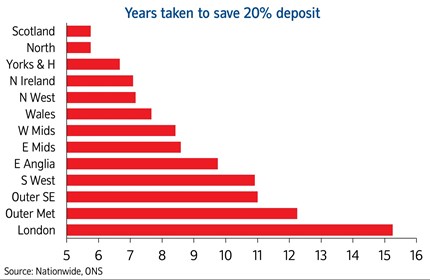
“Scotland and the North region have the lowest house price to earnings ratios at 3.4. Over the longer term, Northern England and Scotland have historically seen lower HPERs than Southern England, Wales and Northern Ireland.
“But there is substantial regional variation, as illustrated below, which shows the average time it would take someone earning the typical wage in each region to save a 20% deposit towards an average FTB property, assuming they set aside 15% of their take-home pay each month.

Local affordability update
- London borough of Westminster is least affordable; Inverclyde in Scotland is most affordable
- East Midlands has smallest gap between least and most affordable areas
- Only c10% of local authorities have seen an improvement in affordability over past year
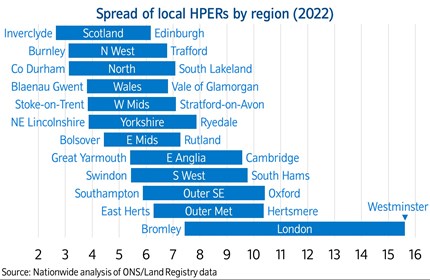
“As well as affordability becoming more stretched across all regions, there is also considerable variation within regions. Our local affordability metrics, which use house price and earnings data from the Land Registry & Office for National Statistics (ONS), give the most comprehensive view at a local level.
“As illustrated by the chart below, London continues to have the greatest gap between the most and least affordable boroughs – by a considerable margin. Meanwhile, the East Midlands has the smallest difference between local authority house price to earnings ratios (HPERs).

Least affordable local authorities
“The table below shows the least affordable local authorities, as measured by the first time buyer HPER in each region. Note that data is not available for Northern Ireland.
|
Least affordable local authorities (2022) |
||
|
Region |
Local Authority |
HPER |
|
London |
Westminster |
15.6 |
|
Outer South East |
Oxford |
10.4 |
|
Outer Metropolitan |
Hertsmere |
10.4 |
|
South West |
South Hams |
9.8 |
|
East Anglia |
Cambridge |
9.6 |
|
Yorkshire & The Humber |
Ryedale |
7.9 |
|
East Midlands |
Rutland |
7.3 |
|
West Midlands |
Stratford-on-Avon |
7.1 |
|
North |
South Lakeland |
7.1 |
|
Wales |
Vale of Glamorgan |
6.8 |
|
North West |
Trafford |
6.8 |
|
Scotland |
Edinburgh |
6.2 |
Most affordable local authorities
“We’ve also explored the most affordable areas, based on the local authorities with the lowest first time buyer HPERs within each region (see table below).
|
Most affordable local authorities (2022) |
||
|
Region |
Local Authority |
HPER |
|
Scotland |
Inverclyde |
2.6 |
|
North West |
Burnley |
3.1 |
|
North |
County Durham |
3.1 |
|
Wales |
Blaenau Gwent |
3.8 |
|
West Midlands |
Stoke-on-Trent |
3.8 |
|
Yorkshire & The Humber |
North East Lincolnshire |
3.9 |
|
East Midlands |
Bolsover |
4.4 |
|
East Anglia |
Great Yarmouth |
5.4 |
|
South West |
Swindon |
5.4 |
|
Outer South East |
Southampton |
5.9 |
|
Outer Metropolitan |
East Hertfordshire |
6.3 |
|
London |
Bromley |
7.4 |
Which areas have seen an improvement in affordability?
“The table below shows the areas that have seen the biggest improvement in housing affordability over the last year, by comparing the FTB HPER in 2022 with 2021. Note, no local authorities in East Anglia have seen an improvement in affordability in this period.
|
Region |
Local Authority |
HPER 2021 |
HPER 2022 |
Chg. (ppts) |
|
South West |
Tewkesbury |
6.8 |
5.9 |
-0.9 |
|
Outer Met |
Three Rivers |
9.7 |
8.8 |
-0.9 |
|
London |
Brent |
11.1 |
10.2 |
-0.8 |
|
East Mids |
Melton |
7.3 |
6.5 |
-0.8 |
|
Outer SE |
Colchester |
6.5 |
6.2 |
-0.3 |
|
North |
Northumberland |
4.2 |
3.9 |
-0.3 |
|
North West |
Pendle |
3.7 |
3.5 |
-0.3 |
|
Scotland |
Aberdeen |
3.4 |
3.1 |
-0.3 |
|
West Mids |
Staffs Moorlands |
5.0 |
4.8 |
-0.3 |
|
Yorks & H |
Calderdale |
4.2 |
4.2 |
-0.1 |
|
Wales |
Conwy |
5.3 |
5.2 |
-0.1 |
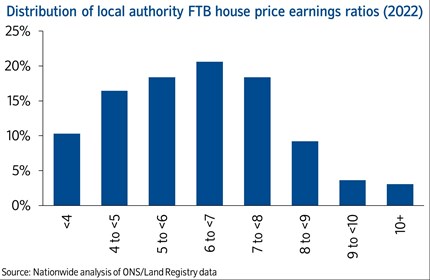
“The chart below shows the distribution of local first time buyer house price to earnings ratios. Only 10% of local authorities have a HPER below 4, while 16% have a HPER of eight or above."

-ends-