|
Headlines |
Mar-23 |
Feb-23 |
|
Monthly Index* |
515.6 |
519.6 |
|
Monthly Change* |
-0.8% |
-0.5% |
|
Annual Change |
-3.1% |
-1.1% |
|
Average Price (not seasonally adjusted) |
£257,122 |
£257,406 |
* Seasonally adjusted figure (note that monthly % changes are revised when seasonal adjustment factors are re-estimated)
Commenting on the figures, Robert Gardner, Nationwide's Chief Economist, said:
“March saw a further decline in annual house price growth, with prices down 3.1% compared with the same month last year. March also saw a further monthly price fall (-0.8%) – the seventh in a row – which leaves prices 4.6% below their August peak (after taking account of seasonal effects).
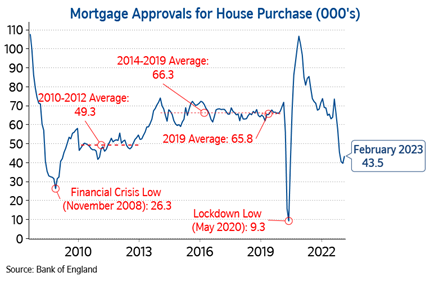
“The housing market reached a turning point last year as a result of the financial market turbulence which followed the mini-Budget. Since then, activity has remained subdued – the number of mortgages approved for house purchase remained weak at 43,500 cases in February, almost 40% below the level prevailing a year ago (see chart below).

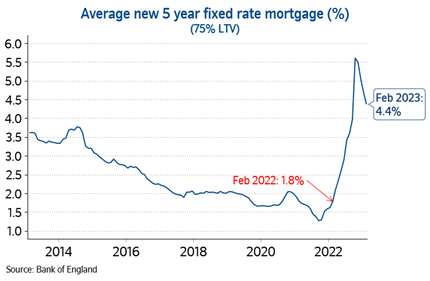
“It will be hard for the market to regain much momentum in the near term since consumer confidence remains weak and household budgets remain under pressure from high inflation. Housing affordability also remains stretched, where mortgage rates remain well above the lows prevailing at this point last year.

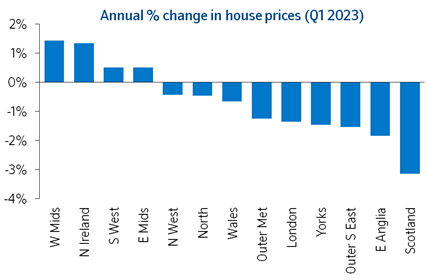
House price growth slowed in all UK regions
“Our regional house price indices are produced quarterly with data for Q1 (the three months to March) showing a further slowdown in annual house price growth in all regions (see full table on page 4). Indeed, nine out of our 13 regions recorded annual house price declines in Q1.
“Scotland remained the weakest performing region with prices down 3.1% compared with a year ago, a sharp slowing from the 3.3% year-on-year increase the previous quarter.

“East Anglia, which was the strongest performing region last quarter, saw a significant slowdown, with prices falling 1.8% year-on-year, making it the weakest performing English region. The neighbouring Outer South East saw a 1.5% year-on-year decline, while London saw a 1.4% fall.
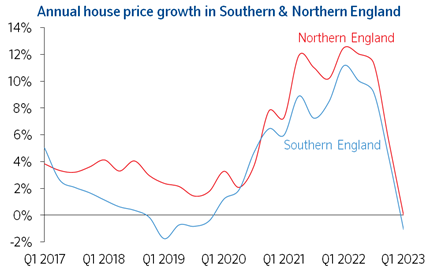
“The West Midlands was the strongest performing region, with prices up 1.4% compared with a year ago. Across northern England overall (which comprises North, North West, Yorkshire & The Humber, East Midlands and West Midlands), prices were flat compared with Q1 2022. Meanwhile southern England (South West, Outer South East, Outer Metropolitan, London and East Anglia) saw a 1.1% decline.

“Northern Ireland saw a noticeable slowing in annual house price growth, although prices were still up 1.3% year-on-year. Meanwhile in Wales, annual house price growth slowed from 4.5% to -0.7%.”
Quarterly Regional House Price Statistics - Q1 2023
Please note that these figures are for the three months to March, therefore will show a different UK average price and annual percentage change to our monthly house price statistics.
Regions over the last 12 months
|
Region |
Average Price (Q1 2023) |
Annual % change this quarter |
Annual % change last quarter |
|
West Mids |
£236,476 |
1.4% |
6.1% |
|
N Ireland |
£173,393 |
1.3% |
5.5% |
|
South West |
£302,451 |
0.5% |
4.3% |
|
East Midlands |
£228,416 |
0.5% |
5.3% |
|
North West |
£203,629 |
-0.4% |
6.0% |
|
North |
£152,308 |
-0.5% |
5.9% |
|
Wales |
£200,173 |
-0.7% |
4.5% |
|
Outer Met |
£417,155 |
-1.2% |
4.2% |
|
London |
£511,293 |
-1.4% |
4.1% |
|
Yorks & H |
£196,300 |
-1.5% |
4.6% |
|
Outer SE |
£331,919 |
-1.5% |
4.3% |
|
East Anglia |
£272,207 |
-1.8% |
6.6% |
|
Scotland |
£172,676 |
-3.1% |
3.3% |
|
UK |
£258,115 |
-1.0% |
4.8% |
UK Fact File (Q1 2023) |
|
|
Quarterly average UK house price |
£258,115 |
|
Annual percentage change |
-1.0% |
|
Quarterly change* |
-1.8% |
|
Most expensive region |
London |
|
Least expensive region |
North |
|
Strongest annual price change |
West Midlands |
|
Weakest annual price change |
Scotland |
* Seasonally adjusted
Nations – annual & quarterly price change
|
Nation |
Average Price (Q1 2023) |
Annual % change this quarter |
Quarterly % change* |
|
N Ireland |
£173,393 |
1.3% |
-1.3% |
|
Wales |
£200,173 |
-0.7% |
-1.7% |
|
England |
£295,801 |
-0.7% |
-1.9% |
|
Scotland |
£172,676 |
-3.1% |
-2.3% |
* Seasonally adjusted
-ends-