|
Headlines |
Oct-23 |
Sep-23 |
|
Monthly Index* |
517.2 |
512.8 |
|
Monthly Change* |
0.9% |
0.1% |
|
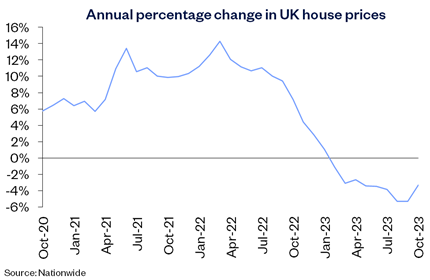
Annual Change |
-3.3% |
-5.3% |
|
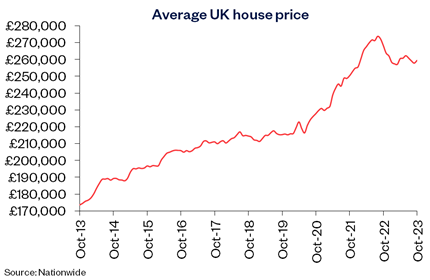
Average Price (not seasonally adjusted) |
£259,423 |
£257,808 |
* Seasonally adjusted figure (note that monthly % changes are revised when seasonal adjustment factors are re-estimated)
Commenting on the figures, Robert Gardner, Nationwide's Chief Economist, said:
“October saw a 0.9% rise in UK house prices, after taking account of seasonal effects. This resulted in an improvement in the annual rate of house price growth to -3.3%, from -5.3% in September.
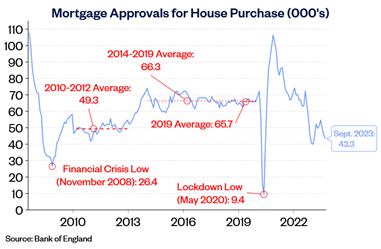
“Nevertheless, housing market activity has remained extremely weak, with just 43,300 mortgages approved for house purchase in September, around 30% below the monthly average prevailing in 2019.
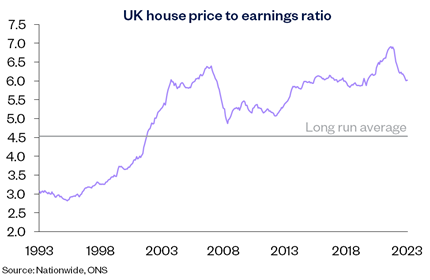
“This is not surprising as affordability remains stretched. Market interest rates, which underpin mortgage pricing, have moderated somewhat but they are still well above the lows prevailing in 2021.
“The uptick in house prices in October most likely reflects the fact that the supply of properties on the market is constrained. There is little sign of forced selling, which would exert downward pressure on prices, as labour market conditions are solid and mortgage arrears are at historically low levels.
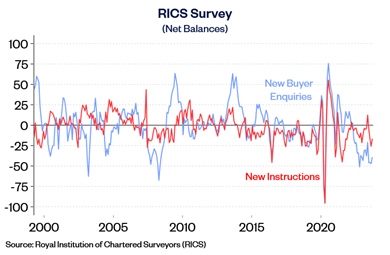
“Activity and house prices are likely to remain subdued in the coming quarters. Despite signs that cost-of-living pressures are easing, with the rate of inflation now running below the rate of average earnings growth, consumer confidence remains weak and surveyors continue to report subdued levels of new buyer enquiries.
“With Bank Rate not expected to decline significantly in the years ahead, borrowing costs are unlikely to return to the historic lows seen in the aftermath of the pandemic.
“Instead, it appears likely that a combination of solid income growth, together with modestly lower house prices and mortgage rates, will gradually improve affordability over time, with housing market activity remaining fairly subdued in the interim.”
Monthly UK House Price Statistics
|
Monthly % Change Seasonally Adjusted |
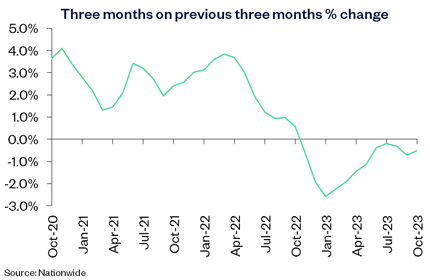
3 month on 3 month % Change |
Annual % Change |
Average Price |
|
|
Oct-21 |
0.9 |
2.4 |
9.9 |
250,311 |
|
Nov-21 |
1.2 |
2.6 |
10.0 |
252,687 |
|
Dec-21 |
1.2 |
3.0 |
10.4 |
254,822 |
|
Jan-22 |
1.0 |
3.1 |
11.2 |
255,556 |
|
Feb-22 |
1.7 |
3.6 |
12.6 |
260,230 |
|
Mar-22 |
1.2 |
3.8 |
14.3 |
265,312 |
|
Apr-22 |
0.1 |
3.7 |
12.1 |
267,620 |
|
May-22 |
0.6 |
3.0 |
11.2 |
269,914 |
|
Jun-22 |
0.1 |
1.9 |
10.7 |
271,613 |
|
Jul-22 |
0.1 |
1.2 |
11.0 |
271,209 |
|
Aug-22 |
0.9 |
0.9 |
10.0 |
273,751 |
|
Sep-22 |
0.0 |
1.0 |
9.5 |
272,259 |
|
Oct-22 |
-1.2 |
0.6 |
7.2 |
268,282 |
|
Nov-22 |
-1.4 |
-0.6 |
4.4 |
263,788 |
|
Dec-22 |
-0.3 |
-1.9 |
2.8 |
262,068 |
|
Jan-23 |
-0.7 |
-2.6 |
1.1 |
258,297 |
|
Feb-23 |
-0.5 |
-2.2 |
-1.1 |
257,406 |
|
Mar-23 |
-0.8 |
-1.9 |
-3.1 |
257,122 |
|
Apr-23 |
0.4 |
-1.4 |
-2.7 |
260,441 |
|
May-23 |
-0.2 |
-1.1 |
-3.4 |
260,736 |
|
Jun-23 |
0.1 |
-0.4 |
-3.5 |
262,239 |
|
Jul-23 |
-0.3 |
-0.2 |
-3.8 |
260,828 |
|
Aug-23 |
-0.7 |
-0.3 |
-5.3 |
259,153 |
|
Sep-23 |
0.1 |
-0.7 |
-5.3 |
257,808 |
|
Oct-23 |
0.9 |
-0.5 |
-3.3 |
259,423 |
-ends-


