|
Headlines |
Dec-23 |
Nov-23 |
|
Monthly Index* |
517.5 |
517.8 |
|
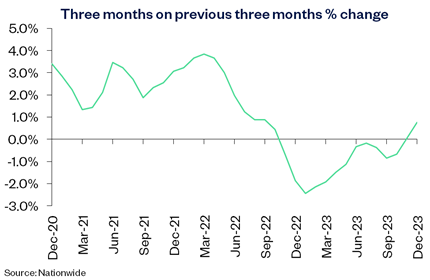
Monthly Change* |
0.0% |
0.2% |
|
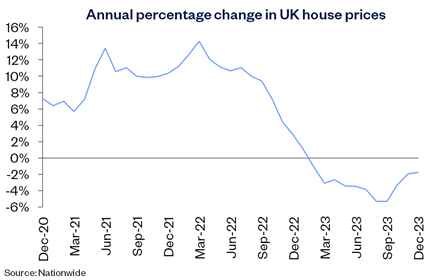
Annual Change |
-1.8% |
-2.0% |
|
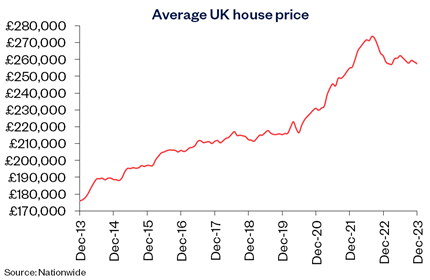
Average Price (not seasonally adjusted) |
£257,443 |
£258,557 |
* Seasonally adjusted figure (note that monthly % changes are revised when seasonal adjustment factors are re-estimated)
Commenting on the figures, Robert Gardner, Nationwide's Chief Economist, said:
“UK house prices ended 2023 down 1.8% compared with December 2022, leaving them almost 4.5% below the all-time high recorded in late summer 2022. Prices were flat compared with November, after taking account of seasonal effects.
Looking back on 2023
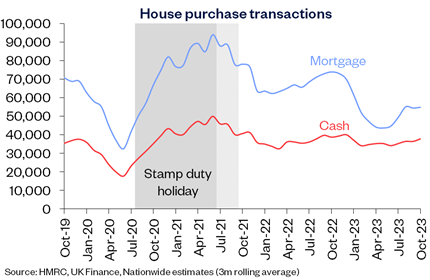
“Housing market activity was weak throughout 2023. The total number of transactions has been running at c10% below pre-pandemic levels over the past six months, with those involving a mortgage down even more (c20%), reflecting the impact of higher borrowing costs. On the flip side, the volume of cash transactions has continued to run above pre-Covid levels.

“Even though house prices are modestly lower and incomes have been rising strongly, at least in cash terms, this hasn’t been enough to offset the impact of higher mortgage rates, which in recent months were still more than three times the record lows prevailing in 2021 in the wake of the pandemic.
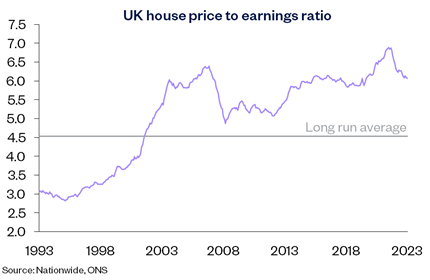
“As a result, housing affordability has remained stretched. A borrower earning the average UK income and buying a typical first-time buyer property with a 20% deposit would have a monthly mortgage payment equivalent to 38% of take-home pay – well above the long run average of 30%.
“At the same time, deposit requirements remain prohibitively high for many of those wanting to buy – a 20% deposit on a typical first-time buyer home equates to c105% of average annual gross income – down from the all-time high of 116% recorded in 2022, but still close to the pre-financial crisis level of 108%.
Where next in 2024?
“There have been some encouraging signs for potential buyers recently, with mortgage rates edging down. Investors have become more optimistic that the Bank of England has already raised rates far enough to return inflation to target and will reduce rates in the years ahead. This shift in view is important, as it has brought down longer-term interest rates, which underpin fixed mortgage rate pricing.
“Nevertheless, a rapid rebound in activity or house prices in 2024 appears unlikely. While cost-of-living pressures are easing, with the rate of inflation now running below the rate of average wage growth, consumer confidence remains weak and surveyors continue to report subdued levels of new buyer enquiries. Moreover, while markets are projecting that the next Bank Rate move will be down, there are still upward risks to interest rates. Inflation is declining, but measures of domestic price pressures remain far too high.
“It appears likely that a combination of solid income growth, together with modestly lower house prices and mortgage rates, will gradually improve affordability over time, with housing market activity remaining fairly subdued in the interim. If the economy remains sluggish and mortgage rates moderate only gradually, as we expect, house prices are likely to record another small decline or remain broadly flat (perhaps 0 to -2%) over the course of 2024.
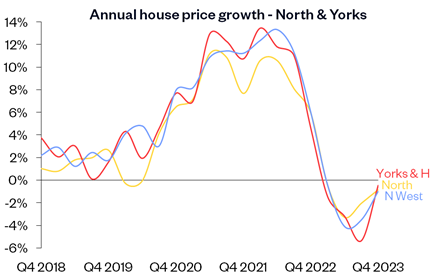
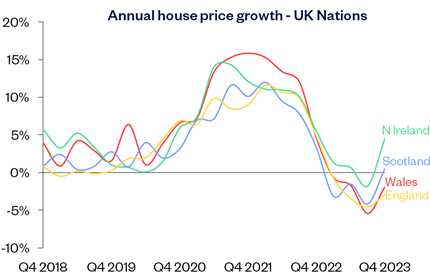
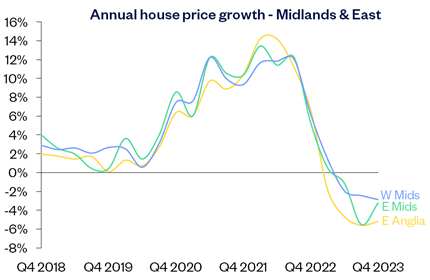
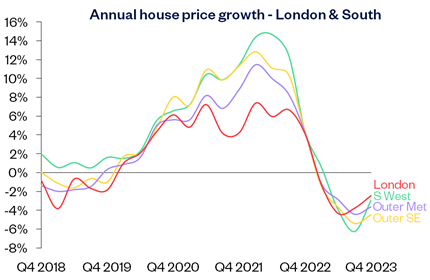
Most regions saw house price falls in 2023
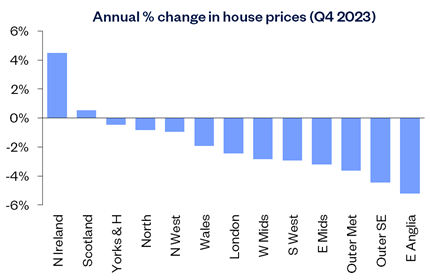
“Our regional house price indices are produced quarterly, with data for Q4 (the three months to December) showing house price declines in all but two areas over the year (see full data below).
“Northern Ireland was the best performer in 2023, with prices up 4.5% over the year. Scotland also recorded a modest annual increase of 0.5% last year.
“East Anglia was the weakest performing region, with prices down 5.2% year on year. Across England overall, prices were down 2.9% compared with Q4 2022, while Wales saw a 1.9% decline.

“Across northern England (which comprises North, North West, Yorkshire & The Humber, East Midlands and West Midlands), prices were down 1.8% year on year. Yorkshire & The Humber was the best performing northern region with an annual rate of change of -0.5%.
“Meanwhile southern England (South West, Outer South East, Outer Metropolitan, London and East Anglia) saw a 3.4% year-on-year fall. London was once again the best performing southern region with a 2.4% annual decline.

Property type review
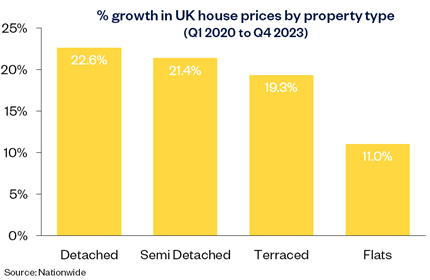
“During 2023, there were signs that more buyers were looking towards smaller, less expensive properties, with transaction volumes for flats holding up better than other property types.
“This may be because affordability for flats has held up relatively better as they experienced less of a price increase over the pandemic period. This is illustrated in the chart on the below, which shows that average prices for flats have increase by 11.0% since Q1 2020 – around half the 22.6% increase for detached properties over the same period.

“However, in our most recent data, we have seen a convergence in the annual rate of price growth for different property types. During 2023, the price of semi-detached properties held up best, recording a 1.8% year-on-year fall. Meanwhile, flats and terraced houses both saw a 2.1% annual decline, while detached properties were the weakest performing with prices down 2.7% over the year.”
-ends-