|
Headlines |
Sep-23 |
Aug-23 |
|
Monthly Index* |
511.7 |
511.9 |
|
Monthly Change* |
-0.0% |
-0.8% |
|
Annual Change |
-5.3% |
-5.3% |
|
Average Price (not seasonally adjusted) |
£257,808 |
£259,153 |
* Seasonally adjusted figure (note that monthly % changes are revised when seasonal adjustment factors are re-estimated)
Commenting on the figures, Robert Gardner, Nationwide's Chief Economist, said:
“Annual house price growth was unchanged at -5.3% in September. Prices were also flat over the month, after taking account of seasonal effects, following the 0.8% decline seen in August.
“Housing market activity remains weak, with just 45,400 mortgages approved for house purchase in August, c.30% below the monthly average prevailing in 2019 before the pandemic struck. This relatively subdued picture is not surprising given the more challenging picture for housing affordability. For example, someone earning an average income and purchasing the typical first-time buyer home with a 20% deposit would spend 38% of their take home pay on their monthly mortgage payment – well above the long-run average of 29%.
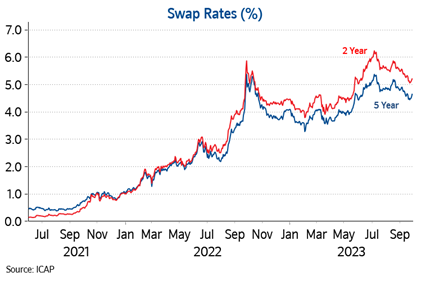
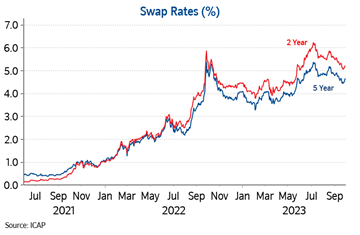
“However, investors have marked down their expectations for the future path of Bank Rate in recent months amid signs that underlying inflation pressures in the UK economy are finally easing, and with labour market conditions softening. This in turn has put downward pressure on longer term interest rates which underpin fixed rate mortgage pricing (see chart below). If sustained, this will ease some of the pressure on those remortgaging or looking to buy a home.
“Nevertheless, with Bank Rate not expected to decline significantly in the years ahead, borrowing costs are unlikely to return to the historic lows seen in the aftermath of the pandemic. Instead, it appears more likely that a combination of solid income growth together with modestly lower house prices and mortgage rates will gradually improve affordability over time, with housing market activity remaining fairly subdued in the interim.
Flats underperformed in recent years
“As we noted in our August report, there are signs that more buyers are looking towards smaller, less expensive properties, with transaction volumes for flats holding up better than other property types.
“This may be because affordability for flats has held up relatively better as they experienced less of a price increase over the pandemic period. This is illustrated in the chart below, where average prices for flats have increased by 12% since the start of the pandemic - half the 24% increase recorded for detached properties.
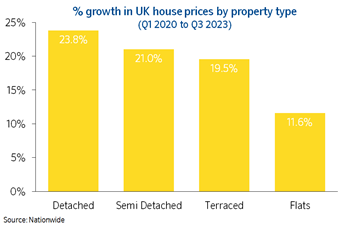
“Despite signs of demand for flats holding up a little better more recently, the price underperformance has continued in the most recent quarterly data, with flats seeing the largest year-on-year fall (-5.7%), compared to -3.6% for detached, -4.6% for semi-detached and -5.3% for terraced properties.
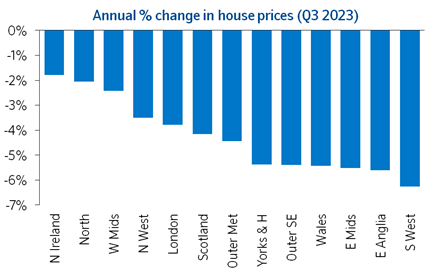
All regions saw annual price falls in Q3
“Our regional house price indices are produced quarterly with data for Q3 (three months to September) showing annual price declines in all regions (see full table below).
“The South West was the weakest performing region, with prices down 6.3% year on year, while Northern Ireland remained the best performing region, with a modest 1.8% fall.
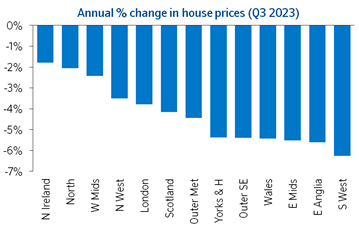
“Wales saw a sharp slowing in the annual rate of change to -5.4%, from -1.4% last quarter. While Scotland also saw a slowing in annual house price growth to -4.2%, from -1.5% in Q2.
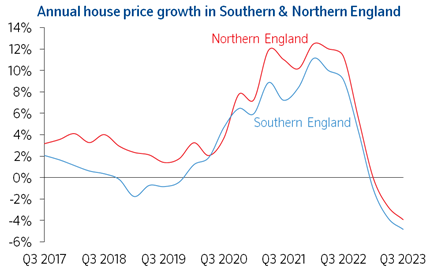
“Across northern England (which comprises North, North West, Yorkshire & The Humber, East Midlands and West Midlands), prices were down 3.9% compared with Q3 2022. The North was the strongest performing northern region, with the annual rate of change improving from -3.3% to -2.0%, while the East Midlands was the weakest, with a 5.5% decline.

“Meanwhile southern England (South West, Outer South East, Outer Metropolitan, London and East Anglia) saw a 4.8% year-on-year fall. London was the best performing southern region, although still saw a 3.8% annual decline.”
Quarterly Regional House Price Statistics - Q3 2023
Please note that these figures are for the three months to September, therefore will show a different UK average price and annual percentage change to our monthly house price statistics.
Regions over the last 12 months
|
Region |
Average Price (Q3 2023) |
Annual % change this quarter |
Annual % change last quarter |
|
N Ireland |
£180,668 |
-1.8% |
0.7% |
|
North |
£156,051 |
-2.0% |
-3.3% |
|
West Midlands |
£241,130 |
-2.4% |
-1.9% |
|
North West |
£205,553 |
-3.5% |
-4.1% |
|
London |
£514,325 |
-3.8% |
-4.3% |
|
Scotland |
£176,814 |
-4.2% |
-1.5% |
|
Outer Met |
£416,365 |
-4.4% |
-2.9% |
|
Yorks & H |
£198,030 |
-5.4% |
-3.2% |
|
Outer S East |
£334,215 |
-5.4% |
-3.7% |
|
Wales |
£202,065 |
-5.4% |
-1.7% |
|
East Midlands |
£228,373 |
-5.5% |
-1.1% |
|
East Anglia |
£273,066 |
-5.6% |
-4.7% |
|
South West |
£301,600 |
-6.3% |
-4.0% |
|
UK |
£260,181 |
-4.7% |
-3.1% |
UK Fact File (Q3 2023) |
|
|
Quarterly average UK house price |
£260,181 |
|
Annual percentage change |
-4.7% |
|
Quarterly change* |
-0.7% |
|
Most expensive region |
London |
|
Least expensive region |
North |
|
Strongest annual price change |
Northern Ireland |
|
Weakest annual price change |
South West |
* Seasonally adjusted
Nations – annual & quarterly price change
|
Nation |
Average Price (Q3 2023) |
Annual % change this quarter |
Quarterly % change* |
|
N Ireland |
£180,668 |
-1.8% |
-1.3% |
|
Scotland |
£176,814 |
-4.2% |
-1.4% |
|
England |
£298,441 |
-4.5% |
-0.6% |
|
Wales |
£202,065 |
-5.4% |
-1.6% |
* Seasonally adjusted
-ends-