|
Headlines |
Jun-22 |
May-22 |
|
Monthly Index* |
537.9 |
536.5 |
|
Monthly Change* |
0.3% |
0.9% |
|
Annual Change |
10.7% |
11.2% |
|
Average Price (not seasonally adjusted) |
£271,613 |
£269,914 |
* Seasonally adjusted figure (note that monthly % changes are revised when seasonal adjustment factors are re-estimated)
Commenting on the figures, Robert Gardner, Nationwide's Chief Economist, said:
“UK annual house price growth slowed modestly to 10.7% in June, from 11.2% in May. Prices rose by 0.3% month-on-month, after taking account of seasonal effects, the 11th consecutive monthly increase.
“The price of a typical UK home climbed to a new record high of £271,613, with average prices increasing by over £26,000 in the past year.
“There are tentative signs of a slowdown, with the number of mortgages approved for house purchases falling back towards pre-pandemic levels in April and surveyors reporting some softening in new buyer enquiries. Nevertheless, the housing market has retained a surprising amount of momentum given the mounting pressure on household budgets from high inflation, which has already driven consumer confidence to a record low.
“Part of the resilience is likely to reflect the current strength of the labour market, where the number of job vacancies has exceeded the number of unemployed people in recent months. Furthermore, the unemployment rate remains close to 50-year lows. At the same time, the stock of homes on the market has remained low, which has helped to keep upward pressure on house prices.
“The market is expected to slow further as pressure on household finances intensifies in the coming quarters, with inflation expected to reach double digits towards the end of the year. Moreover, the Bank of England is widely expected to raise interest rates further, which will also exert a cooling impact on the market if this feeds through to mortgage rates.
Most regions see slight slowing in price growth
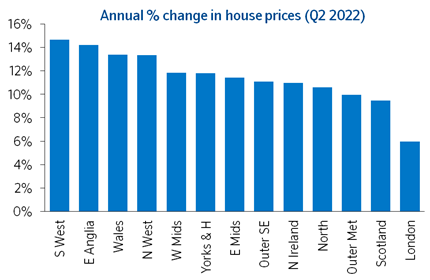
“Our regional house price indices are produced quarterly, with data for Q2 (the three months to June) showing a softening in annual house price growth in nine of the UK’s 13 regions (see table on page 4).
“The South West overtook Wales as the strongest performing region in Q2, with house prices up 14.7% year-on-year, a slight increase from the previous quarter. This was closely followed by East Anglia, where annual price growth remained at 14.2%.
“Wales saw a slowing in annual price growth to 13.4%, from 15.3% in the first quarter. Price growth in Northern Ireland was similar to last quarter at 11.0%. Meanwhile, Scotland saw a 9.5% year-on-year rise in house prices.
“There was a slowing in annual house price growth in England to 10.7%, from 11.6% in the previous quarter. While the South West was the strongest performing region, overall southern England saw weaker growth than northern England.
“Within northern England, the North West was the strongest performing region, with price growth picking up to 13.3% year-on-year, from 12.4% in the first quarter.
“London remained the weakest performing UK region, with annual price growth slowing to 6.0%, from 7.4% in the previous quarter.
South West strongest performing region through the pandemic
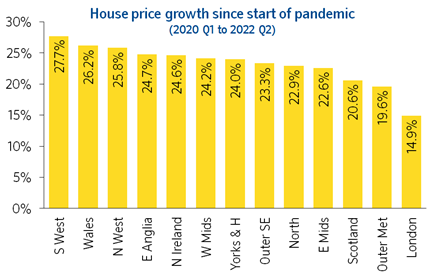
“Looking at house price growth since the onset of the pandemic, we see a similar pattern, with London also the weakest performing region. Since 2020 Q1, average house prices in the capital have increased by 14.9%, whilst all other regions, except the Outer Metropolitan, have seen at least a 20% uplift.
“The South West was also the strongest region over this period, with a 27.7% increase, after taking account of seasonal effects, followed by Wales, where average prices rose 26.2%. Meanwhile in the North West, prices were up 25.8%.
“These trends may reflect a shift in housing preferences; our housing market surveys have pointed to the majority of people looking to move to less urban areas. Our research found that predominantly rural areas have seen stronger price growth in recent years than predominately urban areas. We’ve also seen strong house price growth in a number of areas closely associated with tourism, including parts of Devon, South Wales, the Cotswolds and the Broads. This suggests some of the demand may be being driven by those buying holiday or second homes.”
Quarterly Regional House Price Statistics (Q2 2022)
Please note that these figures are for the three months to June, therefore will show a different UK average price and annual percentage change to our monthly house price statistics.
Regions over the last 12 months
|
Region |
Average Price (Q2 2022) |
Annual % change this quarter |
Annual % change last quarter |
|
South West |
£318,325 |
14.7% |
14.4% |
|
East Anglia |
£289,024 |
14.2% |
14.2% |
|
Wales |
£208,309 |
13.4% |
15.3% |
|
North West |
£213,888 |
13.3% |
12.4% |
|
West Midlands |
£244,167 |
11.8% |
11.7% |
|
Yorks & the Humber |
£205,714 |
11.8% |
13.5% |
|
East Midlands |
£234,828 |
11.4% |
13.5% |
|
Outer SE |
£348,564 |
11.1% |
12.8% |
|
N Ireland |
£181,550 |
11.0% |
11.1% |
|
North |
£159,283 |
10.6% |
10.6% |
|
Outer Met |
£433,558 |
10.0% |
11.4% |
|
Scotland |
£181,422 |
9.5% |
12.0% |
|
London |
£540,399 |
6.0% |
7.4% |
|
UK |
£270,452 |
11.4% |
12.6% |
UK Fact File (Q2 2022) |
|
|
Quarterly average UK house price |
£270,452 |
|
Annual percentage change |
11.4% |
|
Quarterly change* |
2.6% |
|
Most expensive region |
London |
|
Least expensive region |
North |
|
Strongest annual price change |
South West |
|
Weakest annual price change |
London |
* Seasonally adjusted
Nations – annual & quarterly price change
|
Nation |
Average Price (Q2 2022) |
Annual % change this quarter |
Quarterly % change* |
|
Wales |
£208,309 |
13.4% |
2.3% |
|
N Ireland |
£181,550 |
11.0% |
4.2% |
|
England |
£309,774 |
10.7% |
3.0% |
|
Scotland |
£181,422 |
9.5% |
0.8% |
* Seasonally adjusted
-ends-


