|
Headlines |
Mar-24 |
Feb-24 |
|
Monthly Index* |
523.6 |
524.7 |
|
Monthly Change* |
-0.2% |
0.7% |
|
Annual Change |
1.6% |
1.2% |
|
Average Price (not seasonally adjusted) |
£261,142 |
£260,420 |
* Seasonally adjusted figure (note that monthly % changes are revised when seasonal adjustment factors are re-estimated)
Commenting on the figures, Robert Gardner, Nationwide's Chief Economist, said:
“UK house prices fell by 0.2% in March, after taking account of seasonal effects. Nevertheless, the annual rate of house price growth edged higher to 1.6% in March, from 1.2% in February.
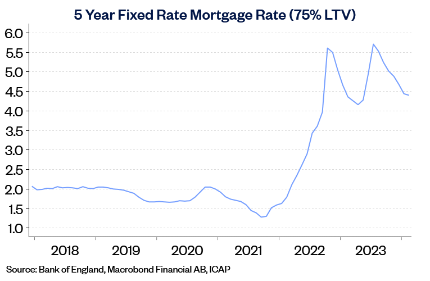
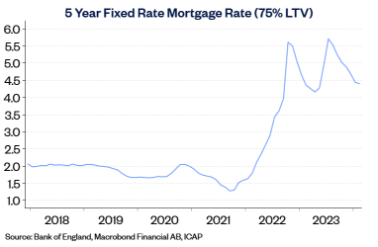
“Activity has picked up from the weak levels prevailing towards the end of 2023 but remains relatively subdued by historic standards. For example, the number of mortgages approved for house purchase in January was around 15% below pre-pandemic levels. This largely reflects the impact of higher interest rates on affordability. While mortgage rates are below the peaks seen in mid-2023, they remain well above the lows prevailing in the wake of the pandemic (as shown in the chart below).
“With cost-of-living pressures easing as inflation moves back towards target, consumer sentiment is improving. Indeed, surveyors report a pickup in new buyer enquiries and new instructions to sell in recent months. Moreover, with income growth continuing to outpace house price growth by a healthy margin, housing affordability is improving, albeit gradually.
“If these trends are maintained, activity is likely to gain momentum, though the pace of the recovery is still likely to be heavily influenced by the trajectory of interest rates.
All regions saw an improvement in annual rate of change in first quarter of 2024
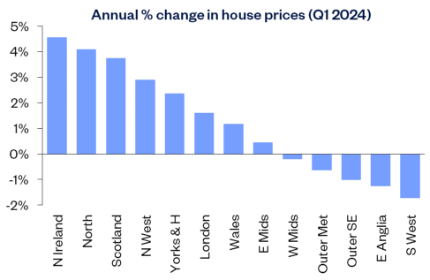
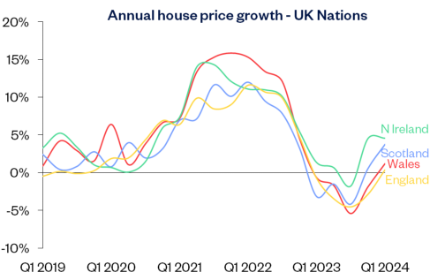
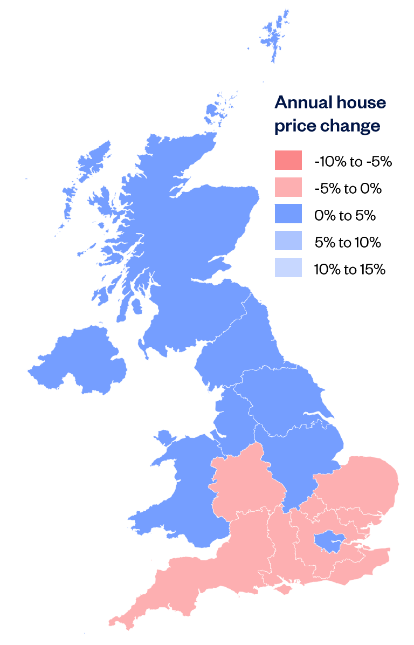
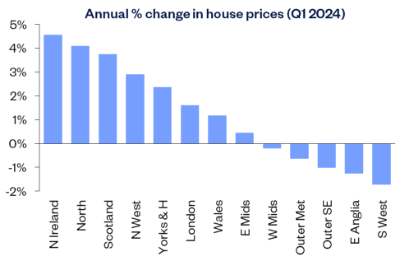
“Our regional house price indices are produced quarterly, with data for Q1 (the three months to March) indicating that while some regions recorded annual price declines, there was an improvement in the annual rate of change across all areas (see full table on page 4).
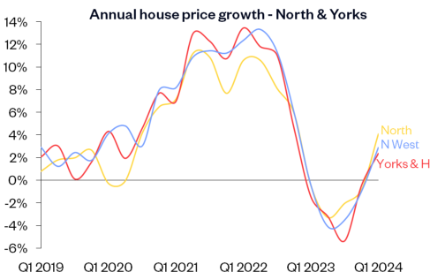
“Northern Ireland remained the best performing area, with prices up 4.6% compared with Q1 2023. The biggest improvement in terms of annual price growth was in the North, where annual price growth picked up from -0.8% in Q4 2023, to 4.1% in Q1 2024, making it the best performing English region.
“Across England overall, prices were up 0.4% compared with Q1 2023, while Wales saw a 1.2% year-on-year rise. Meanwhile, Scotland saw annual price growth pick up to 3.7%.
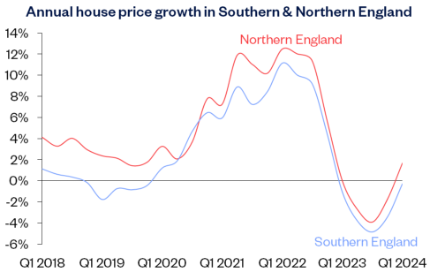
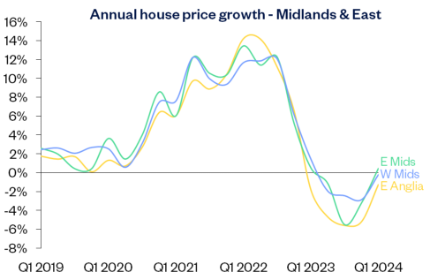
“Across northern England (which comprises North, North West, Yorkshire & The Humber, East Midlands and West Midlands), prices were up 1.7% year on year.
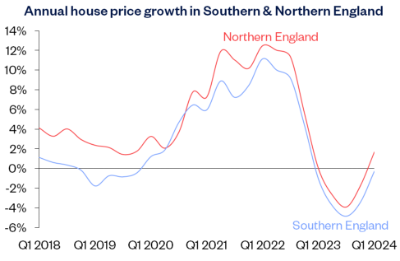
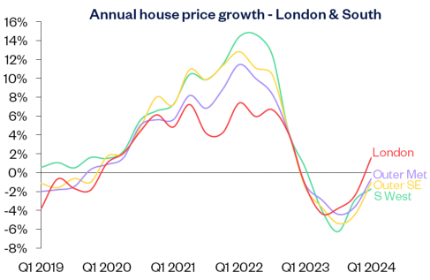
“Meanwhile southern England (South West, Outer South East, Outer Metropolitan, London and East Anglia) saw a 0.3% year-on-year fall. London remained the best performing southern region with annual price growth recovering to 1.6%. The South West was the weakest performing region, with prices down 1.7% year-on-year.”
Quarterly Regional House Price Statistics (Q1 2024)
Please note that these figures are for the three months to March, therefore will show a different UK average price and annual percentage change to our monthly house price statistics.
Regions over the last 12 months
|
Region |
Average price (Q1 2024) |
Annual % chg this quarter |
Annual % chg last quarter |
|
N Ireland |
£181,303 |
4.6% |
4.5% |
|
North |
£158,543 |
4.1% |
-0.8% |
|
Scotland |
£179,148 |
3.7% |
0.5% |
|
North West |
£209,548 |
2.9% |
-1.0% |
|
Yorks & The H |
£200,958 |
2.4% |
-0.5% |
|
London |
£519,505 |
1.6% |
-2.4% |
|
Wales |
£202,533 |
1.2% |
-1.9% |
|
East Midlands |
£229,458 |
0.5% |
-3.2% |
|
West Midlands |
£236,006 |
-0.2% |
-2.8% |
|
Outer Met |
£414,477 |
-0.6% |
-3.6% |
|
Outer S East |
£328,544 |
-1.0% |
-4.5% |
|
East Anglia |
£268,778 |
-1.3% |
-5.2% |
|
South West |
£297,228 |
-1.7% |
-2.9% |
|
UK |
£260,791 |
1.0% |
-2.3% |
|
UK Fact File (Q1 2024) |
|
|
Quarterly average UK house price |
£260,791 |
|
Annual percentage change |
1.0% |
|
Quarterly change (seasonally adj.) |
1.2% |
|
Most expensive region |
London |
|
Least expensive region |
North |
|
Strongest annual price change |
Northern Ireland |
|
Weakest annual price change |
South West |
Nations summary table
|
Nations |
Average price (Q1 2024) |
Annual % chg this quarter |
Quarterly % chg |
|
N Ireland |
£181,303 |
4.6% |
-0.6% |
|
Scotland |
£179,148 |
3.7% |
0.9% |
|
Wales |
£202,533 |
1.2% |
1.2% |
|
England |
£297,978 |
0.4% |
0.0% |
-ends-