|
Headlines |
Dec-22 |
Nov-22 |
|
Monthly Index* |
527.5 |
528.3 |
|
Monthly Change* |
-0.1% |
-1.4% |
|
Annual Change |
2.8% |
4.4% |
|
Average Price (not seasonally adjusted) |
£262,068 |
£263,788 |
* Seasonally adjusted figure (note that monthly % changes are revised when seasonal adjustment factors are re-estimated)
Commenting on the figures, Robert Gardner, Nationwide's Chief Economist, said:
“December saw a further sharp slowdown in annual house price growth to 2.8%, from 4.4% in November. Prices fell by 0.1% month-on-month – a much smaller decline than in the previous couple of months. However, December also marked the fourth consecutive monthly price fall - the worst run since 2008, which left prices 2.5% lower than their August peak (after taking account of seasonal effects).
“While financial market conditions have settled, mortgage rates are taking longer to normalise and activity in the housing market has shown few signs of recovery.
“It will be hard for the market to regain much momentum in the near term as economic headwinds strengthen, with real earnings set to fall further and the labour market widely projected to weaken as the economy shrinks.
Can we achieve a soft landing in 2023?
“The recent weakness in mortgage applications may, in part, represent an early seasonal slowdown. With the chaotic backdrop and elevated mortgage rates in recent months, it wouldn’t be surprising if potential buyers have opted to wait until the New Year to see how mortgage rates evolve before deciding to step into the market.
“Longer-term interest rates, which underpin mortgage pricing, have returned towards the levels prevailing before the mini-Budget. If sustained, this should feed through to mortgage rates and help improve the affordability position for potential buyers, as will solid rates of income growth (with wage growth currently running at a c.7% pace in the private sector), especially if combined with weak or negative house price growth.
“But the main factor that would help achieve a relatively soft landing (especially for house prices) is if forced selling can be avoided, and there are good reasons to be optimistic on that front. Most forecasters expect the unemployment rate to rise towards 5% in the years ahead – a significant increase, but this would still be low by historic standards.
“Moreover, household balance sheets remain in good shape with significant protection from higher borrowing costs, at least for a period, with around 85% of mortgage balances on fixed interest rates. Affordability testing has been central to mortgage lending since the financial crisis and typically stress tested at an interest rate above those prevailing at the moment. This means that, while it will be difficult, the vast majority of those refinancing should be able to cope.
“The fact that the housing market remained buoyant in the first three quarters of 2022, despite weak consumer confidence on the back of a stagnant economy, falling real incomes and a near tripling of mortgage rates, provides some reassurance that there will be a pickup in activity in the New Year, although it is likely to remain tepid until the broader economic outlook improves.
“Similarly, while house prices are likely to see a modest decline in 2023 (perhaps of c.5%), a significant deterioration in the labour market or more elevated mortgage rates would probably be required to generate the double-digit declines suggested by some forecasters. While the risks are skewed in that direction, it doesn’t appear to be the most likely outcome.
House price growth slowed in all UK regions
“Our regional house price indices are produced quarterly with data for Q4 (the three months to December) showing a marked slowdown in annual house price growth in all regions (see full table further below).
“This was most pronounced in the South West, the strongest performing region last quarter, which saw annual house price growth slow from 12.5% to 4.3%. East Anglia was the strongest performing region over the year, with average prices increasing by 6.6%. Meanwhile, Scotland was the weakest performing region, with annual growth of 3.3%.
“Wales saw a significant slowdown in growth in the final quarter of 2022, with annual growth slowing from 12.1% in Q3 to 4.5% in Q4. Northern Ireland saw prices increase by 5.5% during 2022, much weaker than the 12.1% rise recorded in 2021.
“England saw a further slowing in annual house price growth to 4.8%, from 9.9% in Q3. While East Anglia was the strongest performing region, southern England continued to see weaker growth overall than northern England.
“Within northern England (which comprises North, North West, Yorkshire & The Humber, East Midlands and West Midlands), the West Midlands was the strongest performing region with prices increasing by 6.1% over the year.
“London remained the weakest performing English region, with annual price growth slowing to 4.1%, from 6.7% in Q3. The surrounding Outer Metropolitan and Outer South East regions saw very similar annual growth in 2022, with prices increasing by 4.2% and 4.3% respectively.
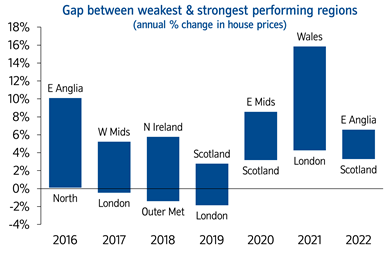
“Recent quarters have seen significant narrowing in the gap between the weakest and strongest performing regions in terms of annual growth, with Q4 2022 seeing the smallest difference - 3.3 percentage points (pp) - in the history of our regional indices, which stretch back to 1974. The largest gap recorded was back in Q1 1989 when annual house price growth in the strongest region (East Midlands at 54.4%) was 53.3pp higher than the weakest (Northern Ireland at 1.1%).
“As shown on the chart below, last year the gap between the best performing region (Wales) and worst performing region (London) was 11.6pp, whilst this year it was just 3.3pp (between East Anglia and Scotland).
“While recent years have seen relatively weak house price growth in London, looking back since the turn of the century it remains the top performing region, with average house prices having increased by 304% since 2000 (by comparison UK average earnings have increased by around 85% over the same period). It has also been the strongest performing region in six out of the last 23 years.
“Meanwhile, the weakest performing region over the same period has been Northern Ireland, which has finished bottom seven times. Nonetheless, average house prices there have still risen by 185% since 2000.
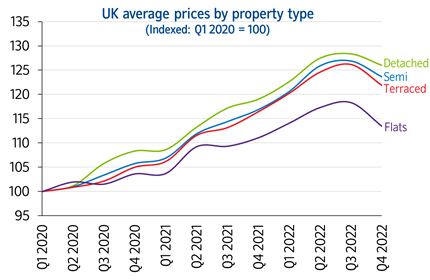
Flats continued to see slower price growth
“While the shifts in housing preferences as a result of the pandemic are now fading, we have continued to see differences in price trends between property types. Detached properties have performed most strongly since the onset of the pandemic, whilst flats have been the weakest.
“Between Q1 2020 and Q4 2022, the average price of a detached property increased by 26.0% (nearly £78,000 in cash terms). Meanwhile, over the same period, flats only increased by 13.4% (around £23,000). The chart below illustrates how the prices of different property types have evolved in recent years.
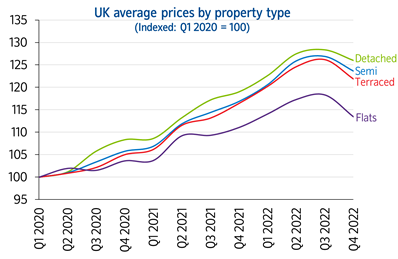
“Annual house price growth slowed markedly across all property types in the final quarter of 2022 but detached were the strongest performing over the year as a whole, with average prices up 5.9%. Meanwhile, the average price of flats increased by just 2.1%.”
Quarterly Regional House Price Statistics (Q4 2022)
Please note that these figures are for the three months to December, therefore will show a different UK average price and annual percentage change to our monthly house price statistics.
Regions over the last 12 months
|
Region |
Average Price (Q4 2022) |
Annual % change this quarter |
Annual % change last quarter |
|
East Anglia |
£285,776 |
6.6% |
11.2% |
|
West Midlands |
£240,975 |
6.1% |
12.0% |
|
North West |
£208,600 |
6.0% |
11.3% |
|
North |
£156,892 |
5.9% |
8.1% |
|
N Ireland |
£176,637 |
5.5% |
10.1% |
|
East Midlands |
£233,459 |
5.3% |
12.3% |
|
Yorks & H |
£199,615 |
4.6% |
11.0% |
|
Wales |
£205,666 |
4.5% |
12.1% |
|
South West |
£307,588 |
4.3% |
12.5% |
|
Outer S East |
£344,027 |
4.3% |
10.4% |
|
Outer Met |
£428,201 |
4.2% |
8.3% |
|
London |
£528,000 |
4.1% |
6.7% |
|
Scotland |
£178,269 |
3.3% |
7.8% |
|
UK |
£265,195 |
4.8% |
10.3% |
UK Fact File (Q4 2022) |
|
|
Quarterly average UK house price |
£265,195 |
|
Annual percentage change |
4.8% |
|
Quarterly change* |
-1.8% |
|
Most expensive region |
London |
|
Least expensive region |
North |
|
Strongest annual price change |
East Anglia |
|
Weakest annual price change |
Scotland |
* Seasonally adjusted
Nations – annual & quarterly price change
|
Nation |
Average Price (Q4 2022) |
Annual % change this quarter |
Quarterly % change* |
|
N Ireland |
£176,637 |
5.5% |
-1.9% |
|
England |
£303,882 |
4.8% |
-1.4% |
|
Wales |
£205,666 |
4.5% |
-2.7% |
|
Scotland |
£178,269 |
3.3% |
-1.9% |
* Seasonally adjusted
-ends-